
In the graph the total GHGs incorporated in the entire biomass supply chain are shown. For example, it can be seen that in the base case more than 90 per cent of solid biomass is delivered at 19 kg CO2eq/GJ while at the same emission levels, more biomass to be mobilised in the Optimistic scenario again thanks to the economy of scale, better infrastructure and better harvest management.
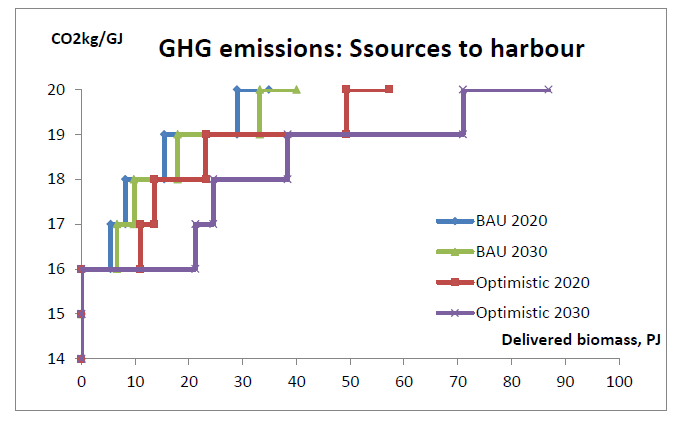
Aggregate greenhouse gas supply curves for the potentials from Kenya